1. Overview
Q: I have an annual statistics table. The number of rows in the table is uncertain; it may range from 2020 to 2023, or from 2020 to 2025. Now I want to add a chart to this table to display the yearly data. How can I dynamically add data rows to the chart?
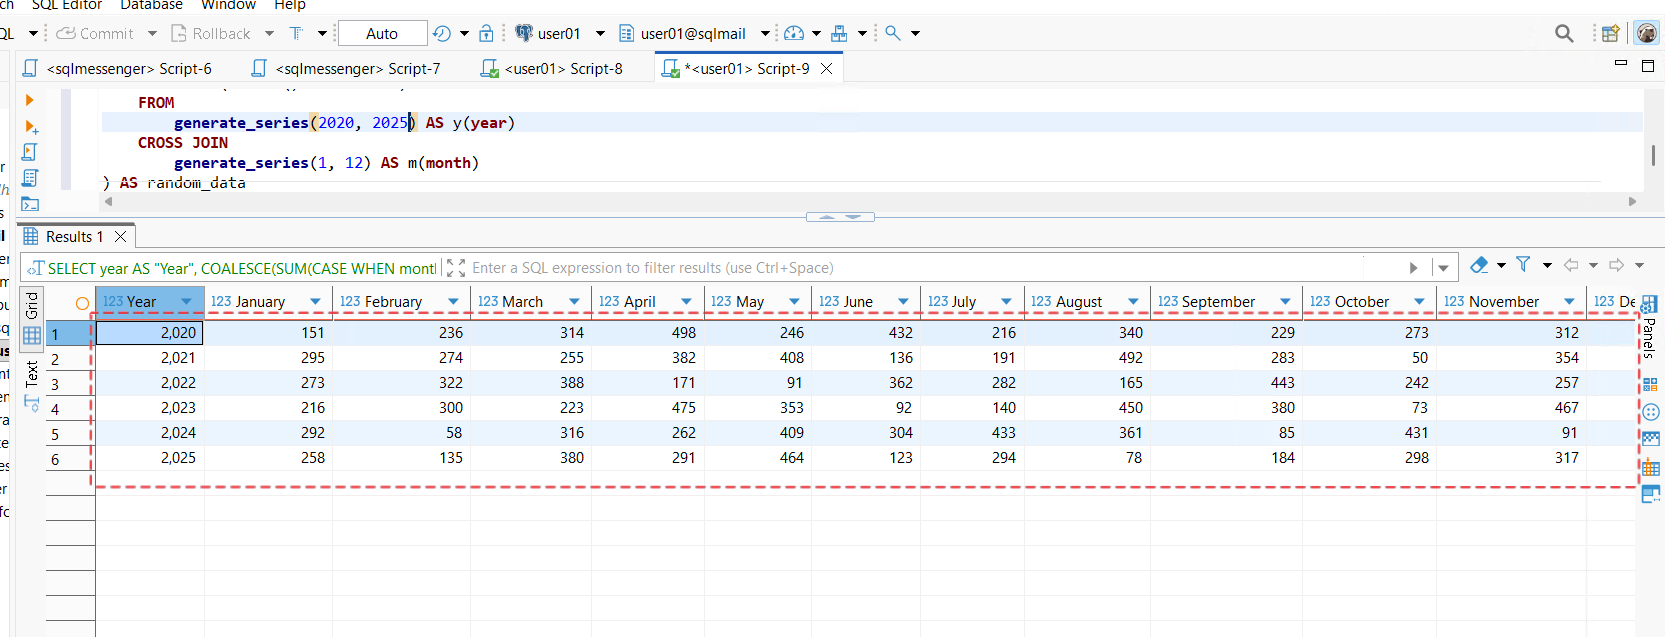
Table data generated by SQL query

The chart effect I want to achieve (dynamically add a series to the chart for each data row)
A: SQLMessenger version 2.4 provides the function of "Adding queried data rows to the chart". You can use this function to dynamically add data to the chart.
Note: This function requires Microsoft Office (2010 or above) to be installed on your computer.
Tips: We have configured a demo task according to your description, and you can see the running effect of the task through this demo task. Click here to download the configuration file of the demo task. Click here to learn how to use the downloaded task configuration file.
2. Configuration Steps
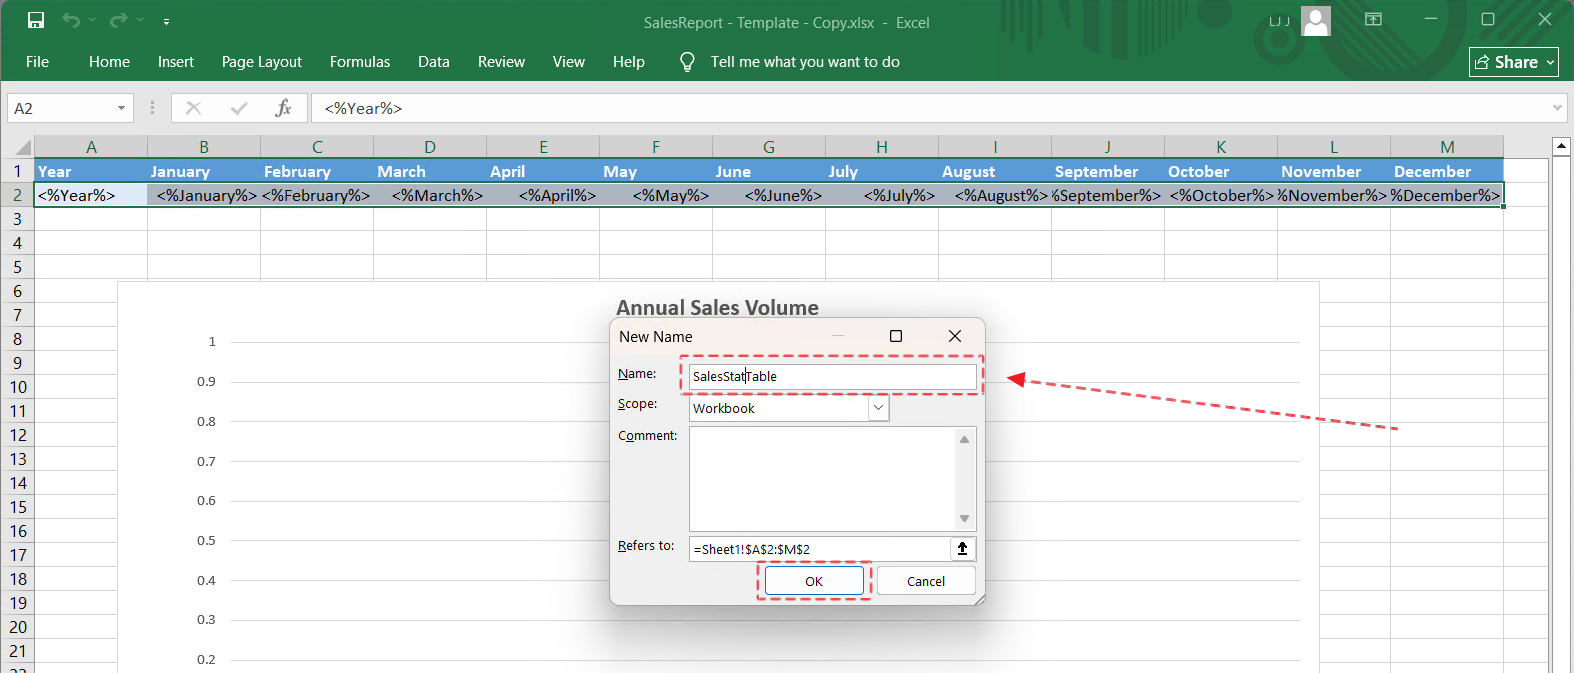
2.1 Design an Excel template. When designing the template, create a "Named Range" on the cell area to be filled. In this example, create a range named "SalesStatTable".
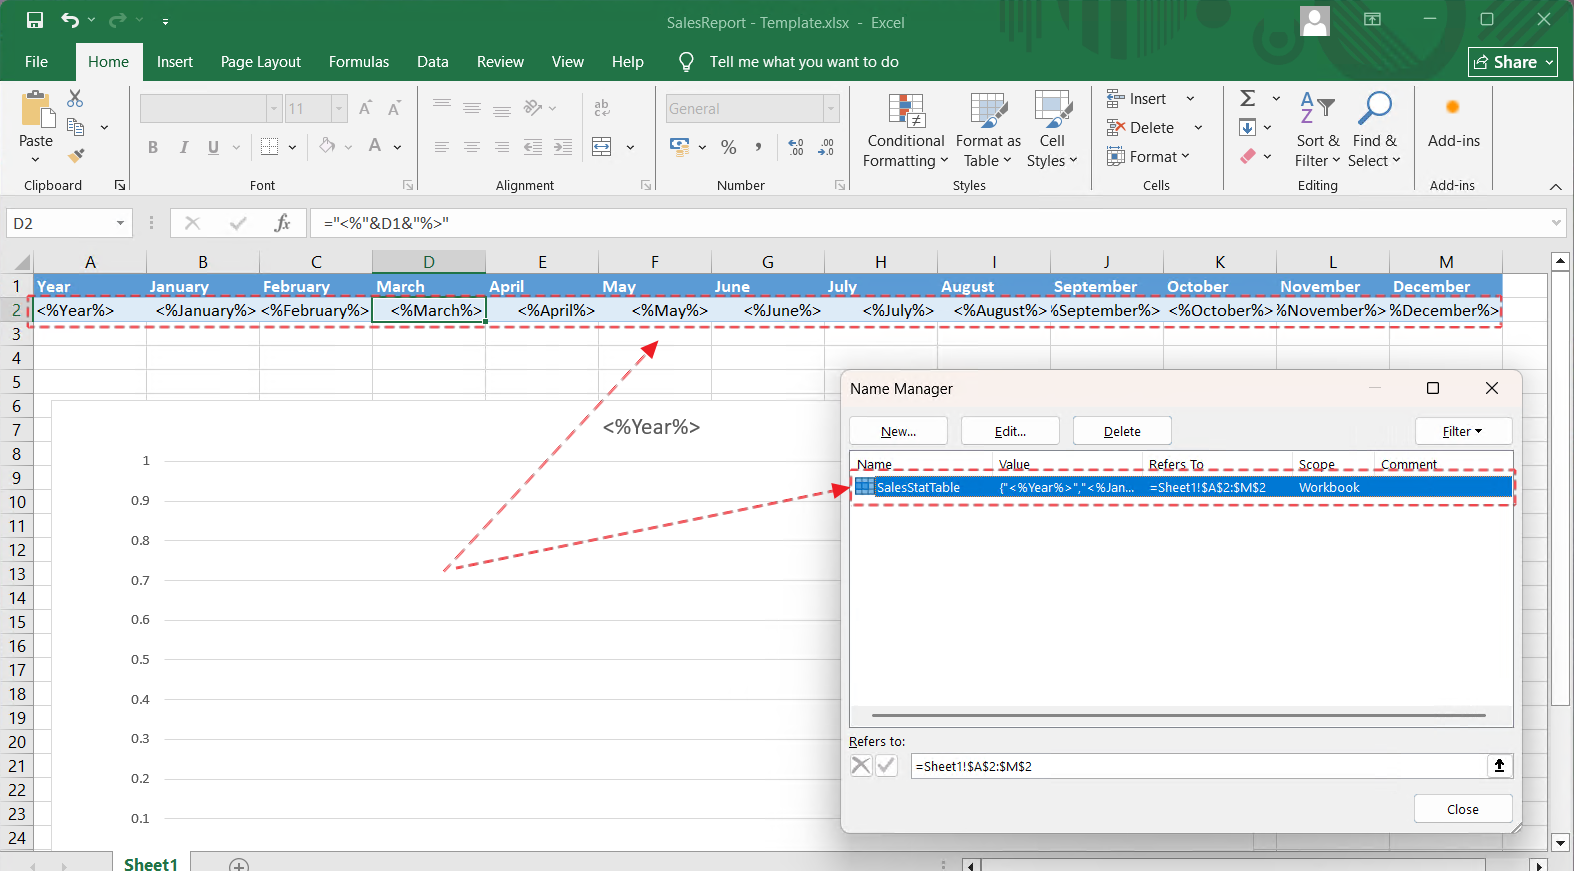
Create a named range in the table
Step 1: Select cells A2 to M2 in Sheet1, and press the Ctrl+F3 shortcut to open the Name Manager.
Step 2: Click New.
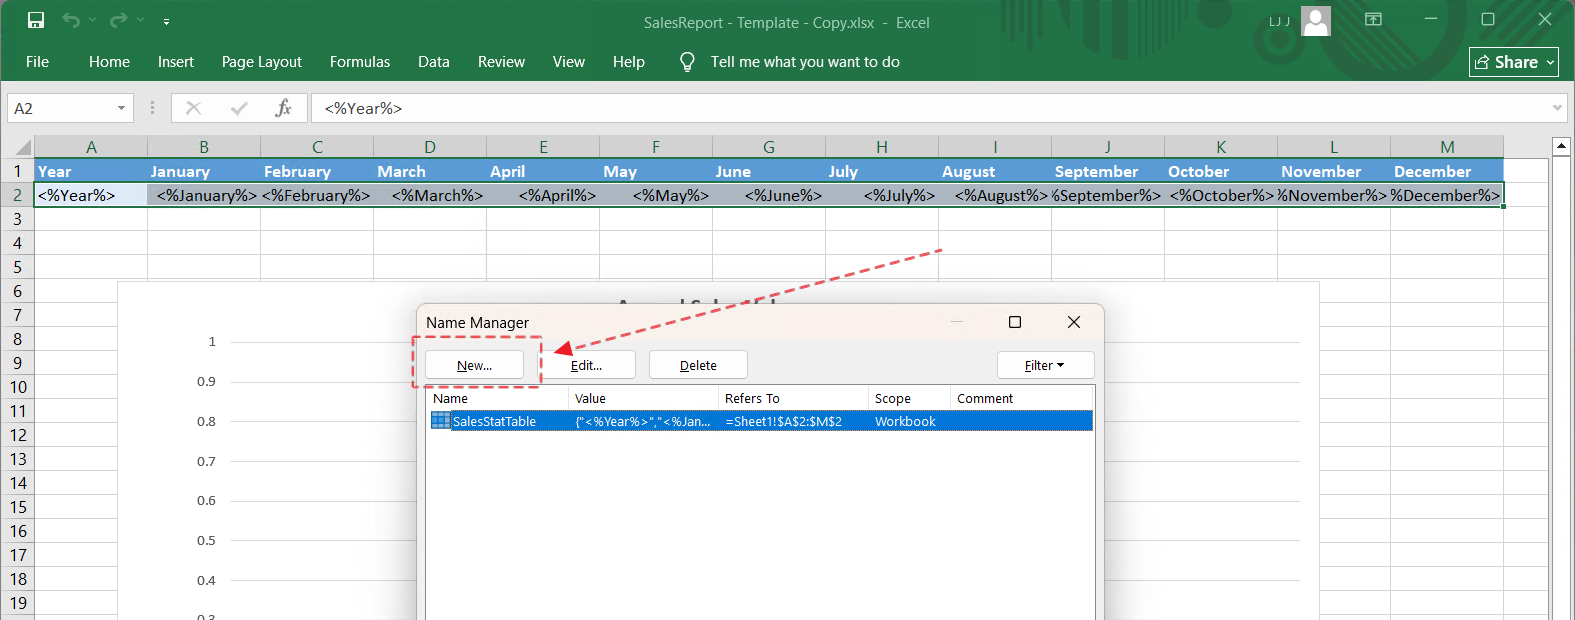
Step 3: Enter a name for the named range, then click OK.
Reference Document:
SQLMessenger User Manual - Using Custom Excel Templates
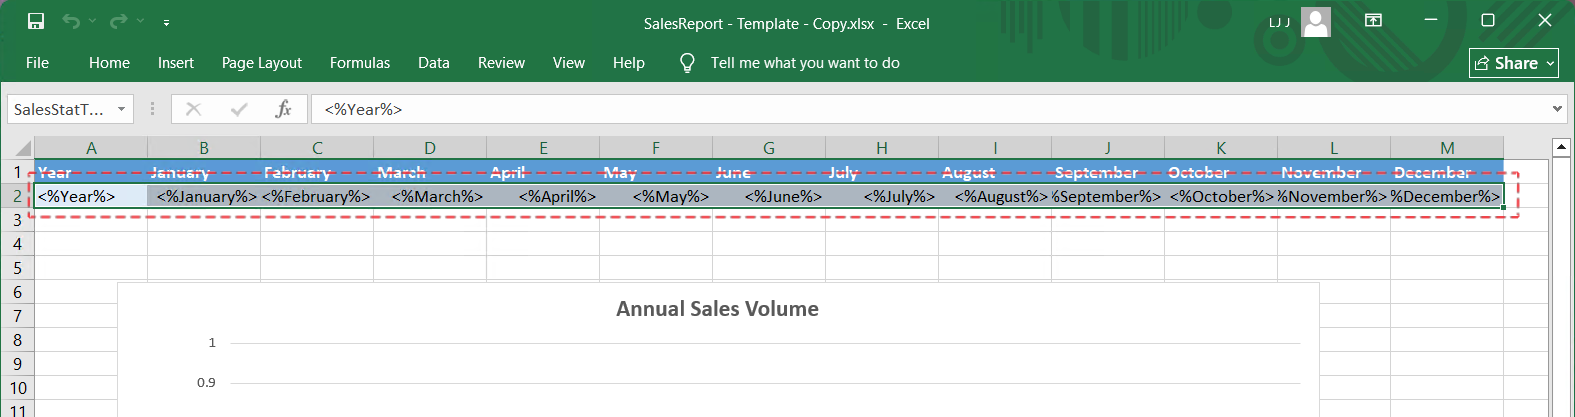
2.2 Add a chart to the template file. And add a series to the chart. In this example, the range of the series name is "=Sheet1!$A$2", and the range of the series values is "=Sheet1!$B$2:$M$2".
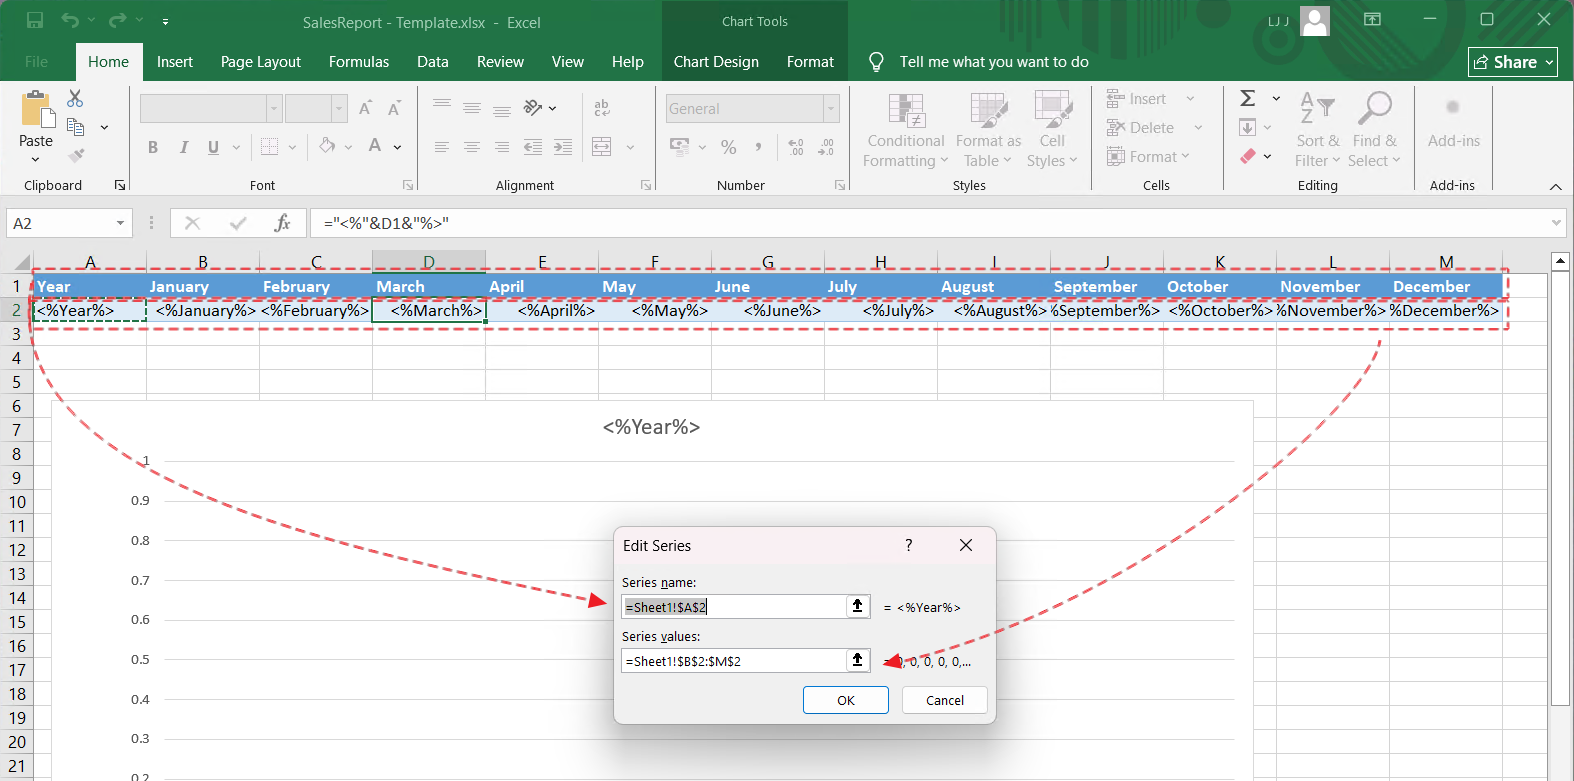
Add a chart to the template file
Reference Document:
SQLMessenger User Manual - Using "Named Range" for the Data Source in Charts
2.3 In SQLMessenger, create an attachment template, and import the template designed in the previous step into the system. Then add a query statement to the template.
When setting the query statement, note that you need to select the Named Range created in step 1 in the "Named Range" option.
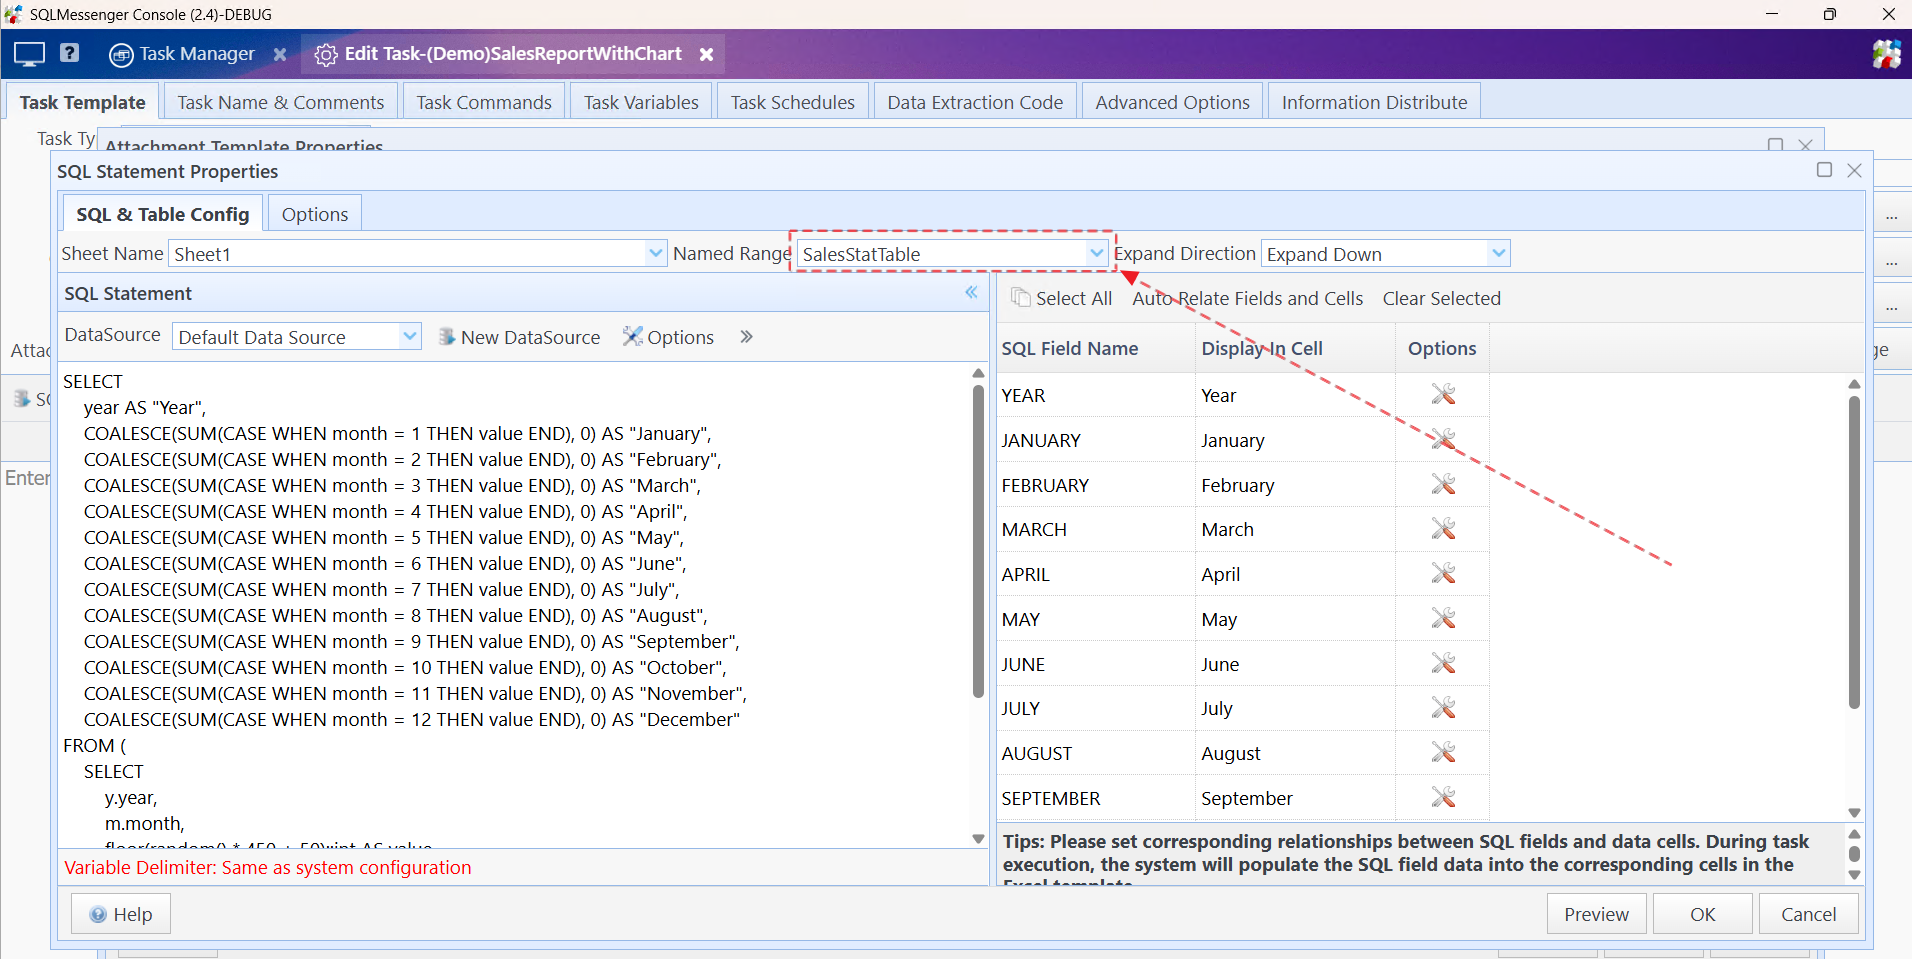
Select the corresponding "Named Range" for the SQL query
In addition, you also need to check the "Append as series at runtime" option in the "Other Options" of the SQL statement, and select the chart to be updated.
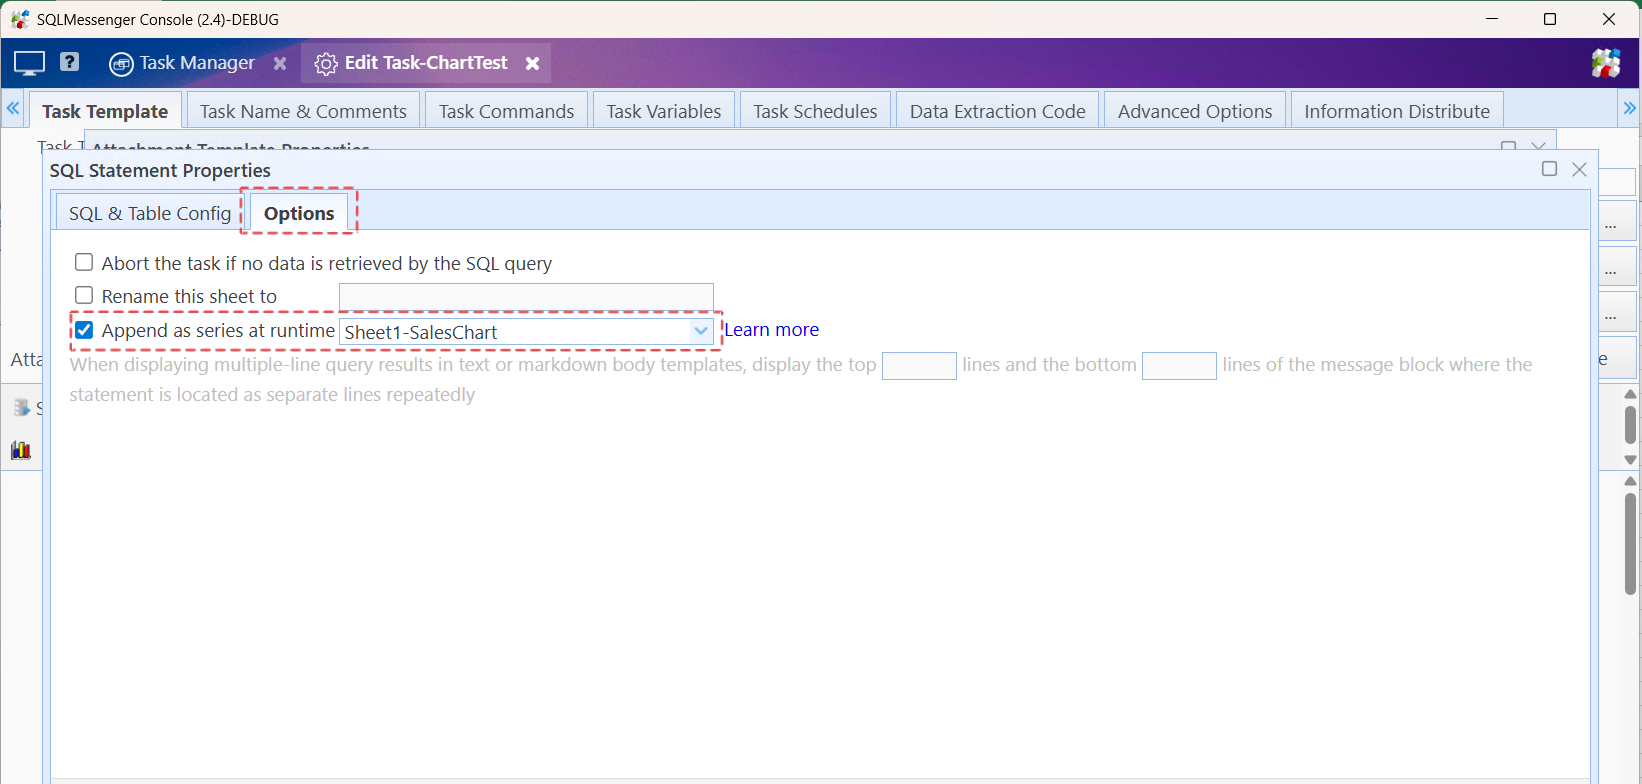
Check the "Append as series at runtime" option and select the chart to be updated
Reference Document:
SQLMessenger User Manual - Using SQL Query in Templates
After completing the above settings, run the task. At this time, the system will automatically add the data rows queried by the SQL statement to the specified chart.
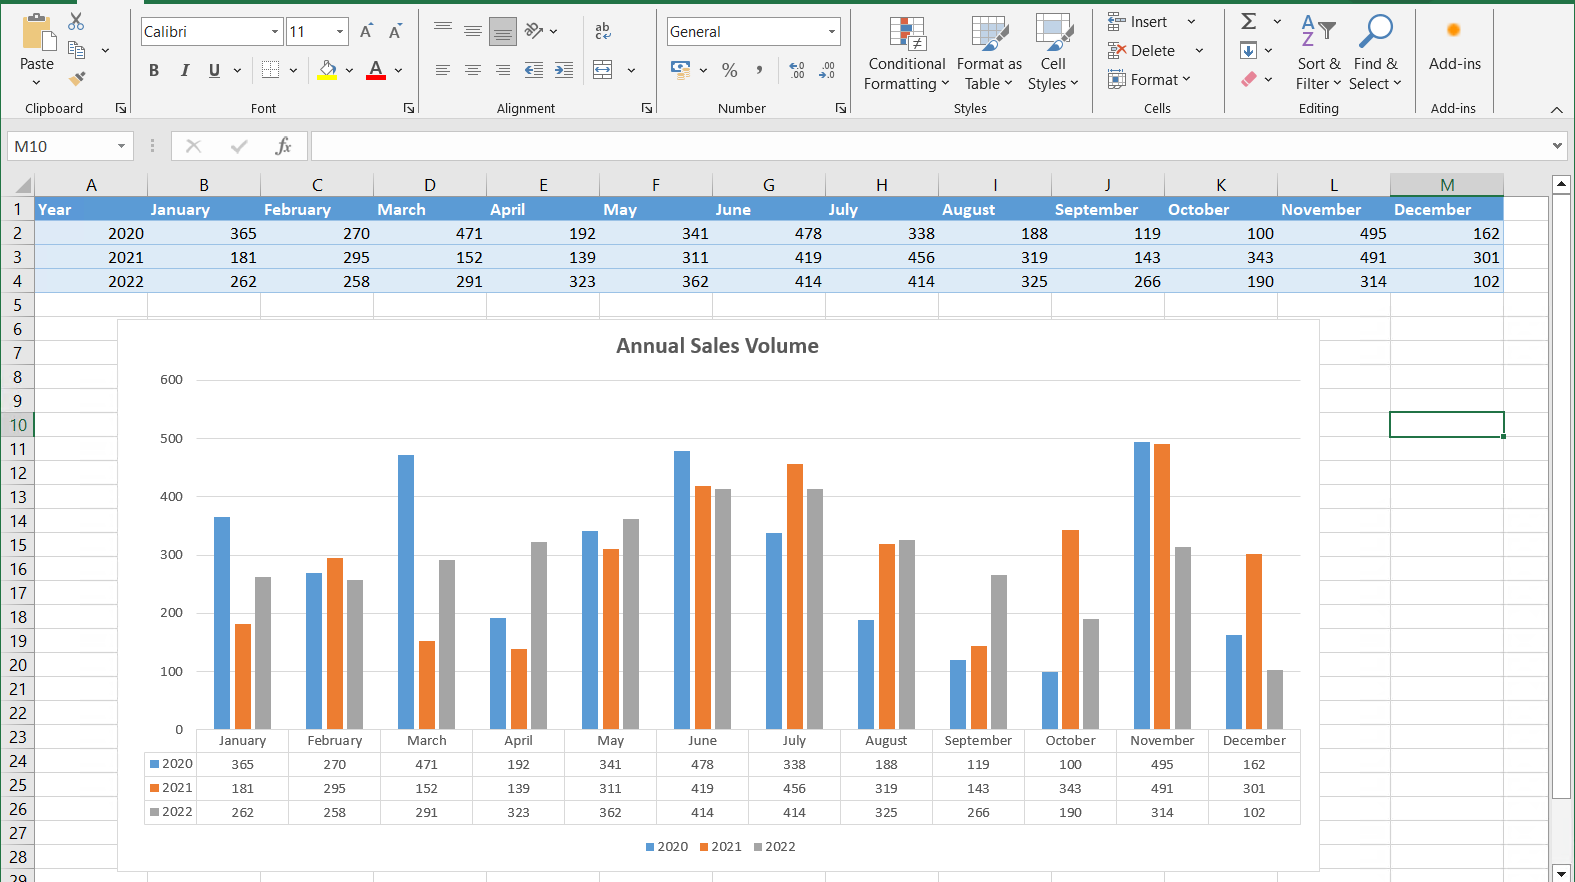
Execution Result 1: Statistical data from 2020 to 2022
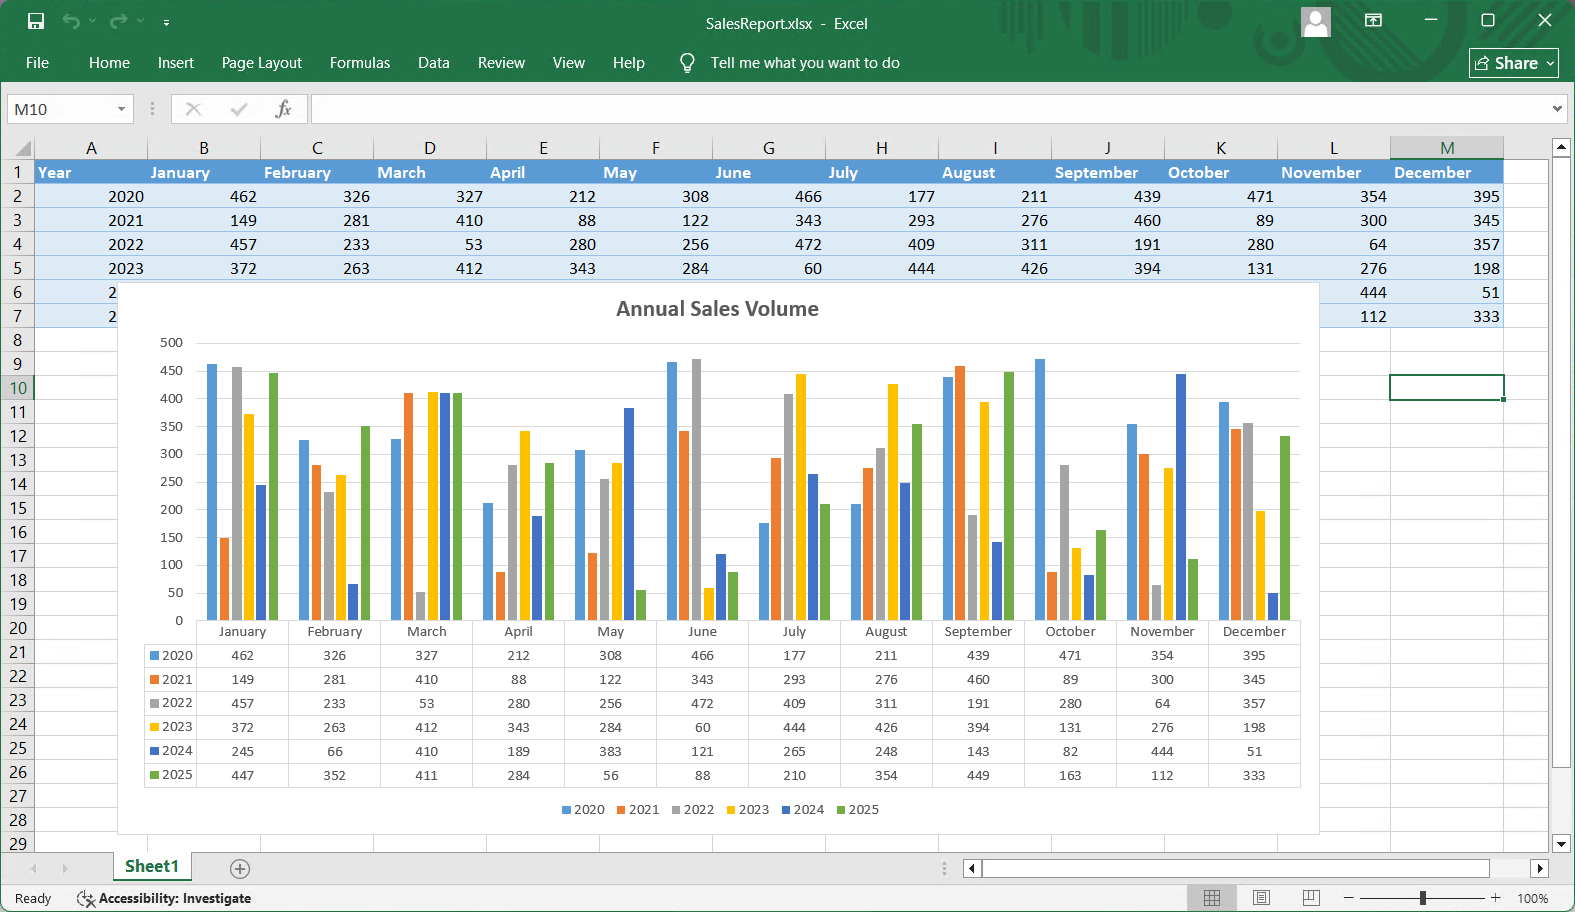
Execution Result 2: Statistical data from 2020 to 2025
Reference Documents:
SQLMessenger User Manual - Using SQL Query in Templates
SQLMessenger User Manual - Using Custom Excel Templates
SQLMessenger User Manual - Using "Named Range" for the Data Source in Charts